9256 Humidity - Mould / Mold - Damp
There is much information online regarding humidity, damp and mould / mold e.g. WHO Guidelines For Indoor Air Quality : Dampness And Mould ISBN 978 92 890 4168 3 - 2009. From the equator to the North and South Poles outdoor air always contains some moisture. The issue that most have is when the moisture in the air condenses on fabric of buildings or materials and fabric within the living space.
At the simplest one only need take a cold drink and put it in a glass from the refrigerator to see condensation form on the exterior of the glass. The condensation forms because the glass is below the dew point temperature of the surrounding air.
If there are any other surfaces at a temperature similar to the glass condensation will also form on them and so they become “damp.”
When the air dew point temperature is higher than the temperature of all surfaces NO condensation will occur.
By having the moisture content in an air conditioned or dehumidified room below dew point temperature moisture content one is ensuring all surfaces are “drying.” The moisture will be moving from the surfaces to the air. Air conditioners and dehumidifiers work by providing the coldest surface, their cooling coils, in a room - the moisture in the air moisture vapour condenses on the coils so drying the air.
I have read that provided the moisture content kept below the ambient air dew point temperature content for at least six hours per day in a room there should be NO mould issues.
To save some more money it would appear to me that one could keep the air conditioned moisture content dew point temperature lower than the lowest observed in the past week by only one or two degrees and this may be sufficient. One would be required to observe temperature and relative humidity to track the lowest dew point of the last week.
Honeywell, IPI and perhaps, others have humidity sensors that log the humidity. The IPI sensor which cost USD 350 in 2015 required recalibration every three years. I would assume that all humidity sensors require recalibration after three years as they probably all use similar technology.
An alternative is to use the nearest airport's figure(s) and perhaps build in a safety factor of another 1 or 2^C
This link http://dpcalc.org/index.php is to a Dew Point Calculator. It is useful in that it indicates “Days to Mold” as well as Mold Risk.
Damp Mould Document
This document shows some results from the above Dew Point Calculator with additional data such as water vapour in grammes per cubic metre and the amount of water vapour in a room 4 m * 4 m * 2.4 m, about a pint, 572 ml, at 25 ^C slightly less than half a pint, 227 ml, at 5 ^C.
Page 2 shows some details and comments of a home dehumidifier
Page 3 WHO guidelines for indoor air quality : dampness and mould ISBN 978 92 890 4168 3 - 2009
2. Building dampness and its effect on indoor exposure to biological and non- biological pollutants
Jeroen Douwes
2.1 Frequency of indoor dampness
A review of studies in several European countries, Canada and the United States in 2004 indicated that at least 20% of buildings had one or more signs of dampness (Institute of Medicine, 2004). This estimate agrees with those of a study of 16 190 people in Denmark, Estonia, Iceland, Norway and Sweden, which gave an overall prevalence of indoor dampness of 18%, with the lowest prevalence in Göteborg, Sweden (12.1%), and the highest in Tartu, Estonia (31.6%) (Gunn-björnsdóttir et al., 2006). Dampness was defined on the basis of self- reported indicators, such as water leakage or damage, bubbles or discoloration of floor coverings, and visible mould growth indoors on walls, floors or ceilings. From several studies conducted in the United States, Mudarri and Fisk (2007) estimated the prevalence of dampness or mould in houses to be approximately 50%
9256_Damp_Mould_01.pdf 256.9kB.
![]()
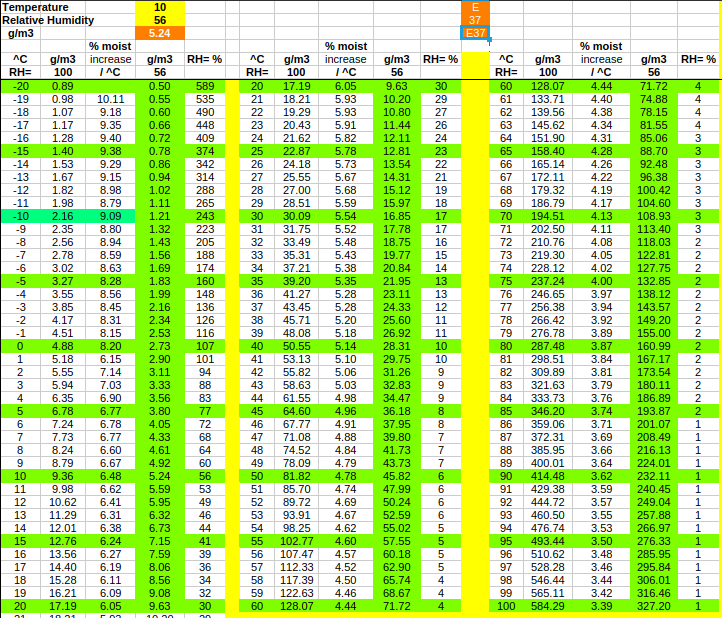
This is a sample of 9256_Temp_RH_01.ods with the temperature set to 10 ^C and Relative Humidity of 56%.
In the spreadsheet vary the values in the yellow background cells to suit observed Temperature ^C and Relative Humidity, RH %
9256_Temp_RH_01.ods 44.66kb.
 . . .
. . .
There are tools available such as pyschrometric charts to calculate the various properties of air due to moisture content.
In the above simplified spreadsheet which is for sea level and standard pressure, approx 1013 mb the values are close enough for most purposes. For much higher or lower altitudes the spreadsheet would require populating with the appropriate 100% moisture contents at the various temperatures -20 - 100 ^C.
It can be seen from the above spreadsheet that the moisture content capacity of air increases by 6.48% with an increase from 9 ^C to 10^C. All other increments per degree are shown between -20 ^C to 100 ^C.
The RH= % column should only reach a maximum of 100%, the values greater than 100% are for interest only.
The highest temperture at which RH= % is 100 is the Dew Point Temperature
The following spreadsheet is rather more complicated than the one above as it can cater for more variables, Humidity_Willim_01.ods [82kb] approx. , with several tabs:-
01_Calc
02_Comfort
03_Wet_Bulb
04_ASHRAE
05_MAC_Inst
06_Temp_RH_Td
Humidity - Water Vapour Vapor - Calculations
NB The spreadsheet has been developed for personal use. There are NO guarantees given. All output is to be verified to the users own satisfaction.
01_Calc
Fill in the two values in yellow cells B6, Temperature, and C6, Relative Humidity, and the various air moisture content results are calculated for sea level. Refer to the Machine Applications Corporation, MAC Handbook on the link on tab 05_MAC_Inst for more details.
Optionally D6 the Wind speed may be input for the calculation of the Australian Apparent Temperature. The Australian Apparent Temperature calculation works throughout Earth's normal air temperature range so there is not a requirement for separate Wind Chill and Heat Index formulae and associated restrictions.
B13, Altitude, metres is a required input for elevations other than sea level
When a dry/wet bulb sling hygrometer has been used input the Wet Bulb temperature in B9 with corresponding Dry bulb temperature and the relative Humidity is shown in C9. If there are many Wet Bulb temperatures to be used set cell C6 “=C9” and then one only need enter the Dry Bulb temperature in cell B6 and Wet Bulb temperature in B9.
The air moisture content properties are output in row 20 with sea level temperature stated.
Cells B26:I34 convert temperatures to/from Celsius and Fahrenheit
Various Heat Indices are given for those interested in comparing.
02_Comfort
An attempt is made on this tab to “define” the comfort zone in the Philippines. When the air is too dry there maybe issues with nose bleeds and static electricity. Should the air be too moist it will be uncomfortable, condensation is likely and issues arising from the condensation may occur. Days to mould / mold are shown over the range 16^C - 35^C
As noted on the tab there is contradictory information the user is left to decide which is most appropriate in each particular case.
03_Wet_Bulb
This shows my comparison of calculated Relative Humidity values for Dry/Wet Bulb temperatures calculated using the formula given in the link in cell BD6 and those on the Arizona.edu/... web site 2017
04_ASHRAE
This tab shows the comparison of published ASHRAE values and those obtained using 01_Calc tab. The Absolute Humidity, AH, g/m3 values calculated using 01_Calc tab vary by less than 1%.
05_MAC_Inst
The data was extracted from the Machine Applications Corporation PDF handbook and compared with those obtained using 01_Calc tab. The handbook gives a good overview of the fallacies and intricacies of dealing with water vapour.
Below 1% Moisture Vapour, % Mv, the Absolute Humidity, AH g/m3, is overestimated above 10% Mv the Absolute Humidity, AH g/m3 is underestimated. Fortunately even in the tropics rarely does the Percentage Moisture Vapour, % Mv, rise above 4%.
My main concern and use of the spreadsheet is regarding my home so I am happy that the Absolute Humidity, AH, g/m3 conforms to within 1% over the “ASHRAE range” of temperatures as shown in 04_ASHRAE tab. I believe the spreadsheet is “more accurate” than drawing lines a pyschrometric chart.
06_Temp_RH_Td
This is essentially a cut down form of 02_Comfort but is much smaller and therefore more convenient to print for checking that the air is below a certain dew point temperature. At 30^C and 55 RH% or 25^C and 74 RH % the dew point temperature, Td, is 20^C.
The calculations are performed in the Calc_1 and Calc_2 tabs as such they are required.
# # # # 20250515 # # # #